Decoding Nike’s Path to Purchase AOV Paradox

Gener8’s interconnected data feeds enable deep understanding of customer purchase journeys
More engagement doesn't always mean higher spend.
An analysis of Nike.com’s customer path to purchase data identified a complex and non-linear relationship between the length of a customer's purchase journey and the final value of their transaction.
The data presents a compelling paradox: while conventional wisdom might suggest that greater engagement, measured in time spent on site and pages viewed, should correlate with higher spending, the reality is more nuanced.
Longer purchase journeys don’t always lead to higher value transactions
At Gener8, we analysed hundreds of validated Nike online purchase journeys and found that the most valuable customers are not those who browse the longest, but rather those who occupy a specific ‘sweet spot’ of engagement.
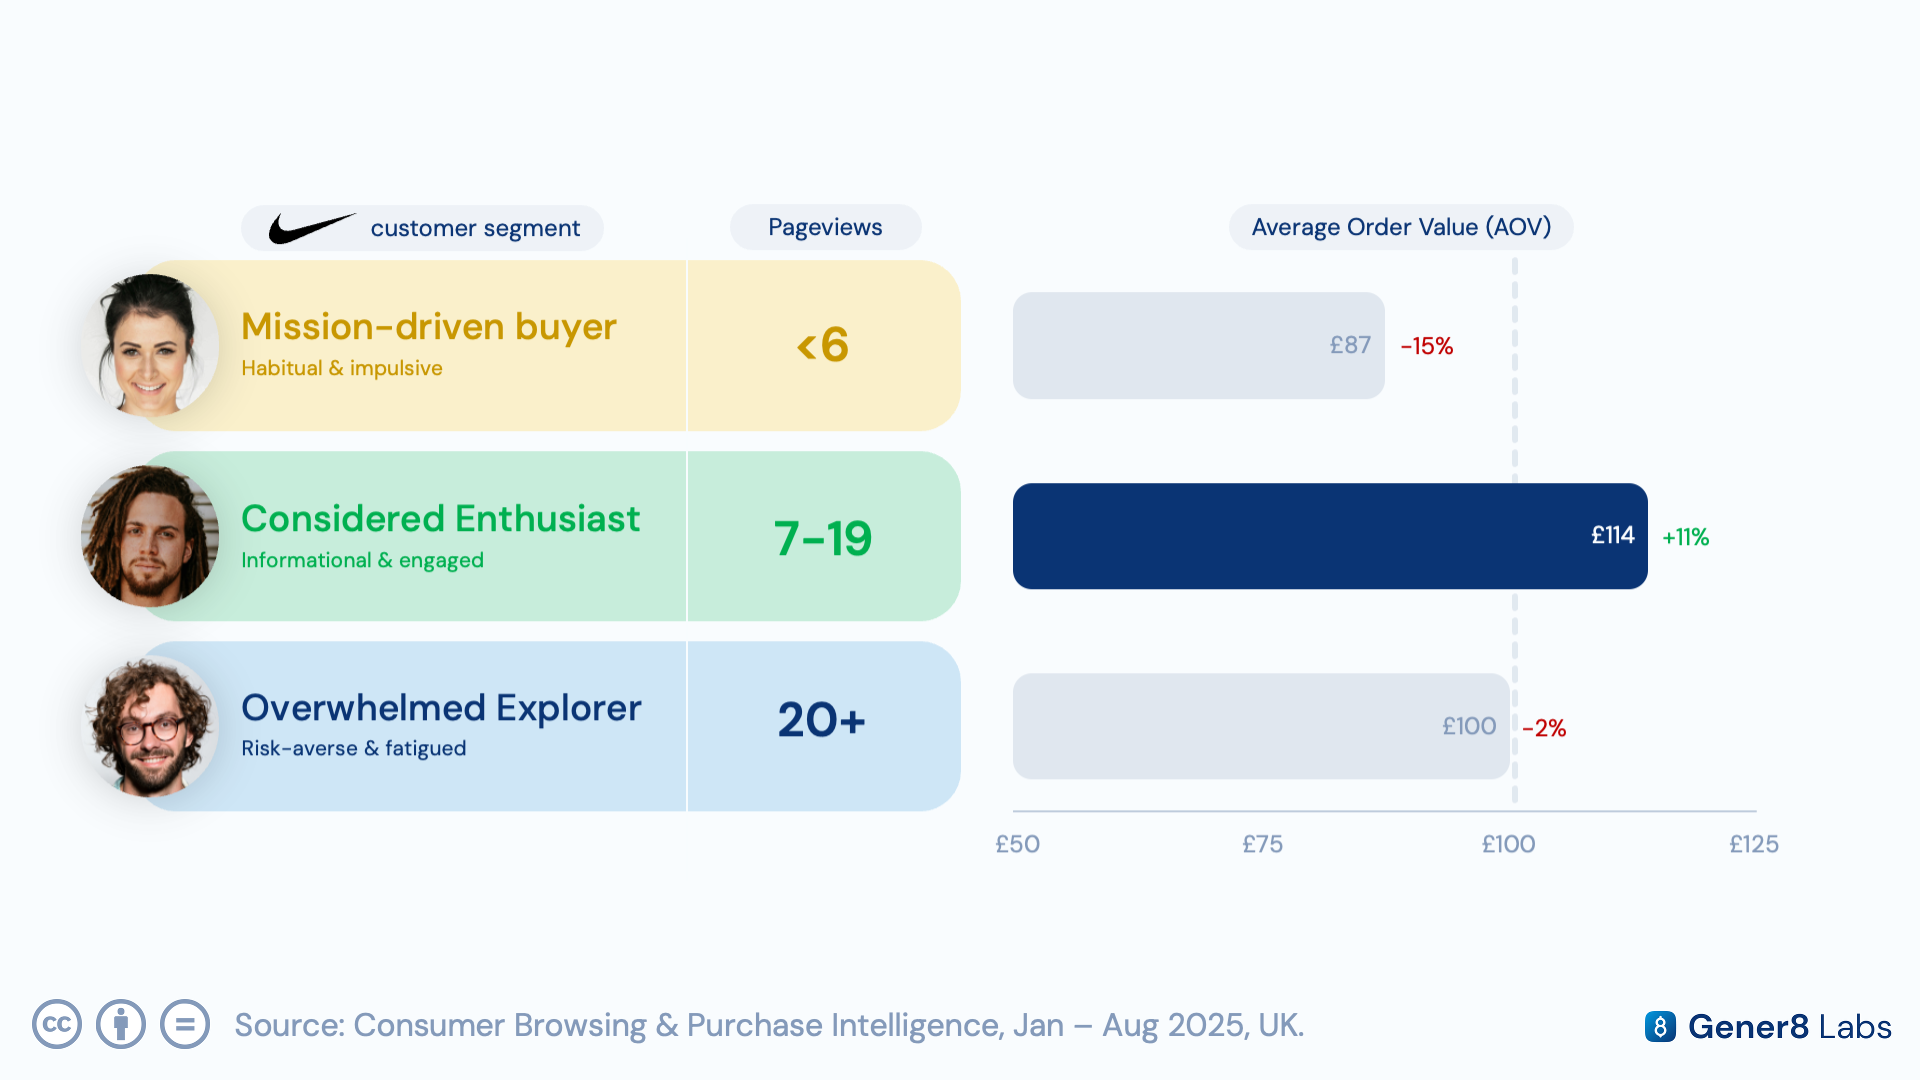
For the analysis, we segmented hundreds of validated Nike store transactions into three equally-sized groups based on two key engagement metrics: pageview visits and time to conversion from the first visit to the site within a 24 hour period. The results showed that moderate engagement yields the highest Average Order Value (AOV), while both low and high engagement levels result in lower transaction values.
When segmented by the number of pageviews, Considered Enthusiasts drive the highest AOV at £114 (+11% vs. average).
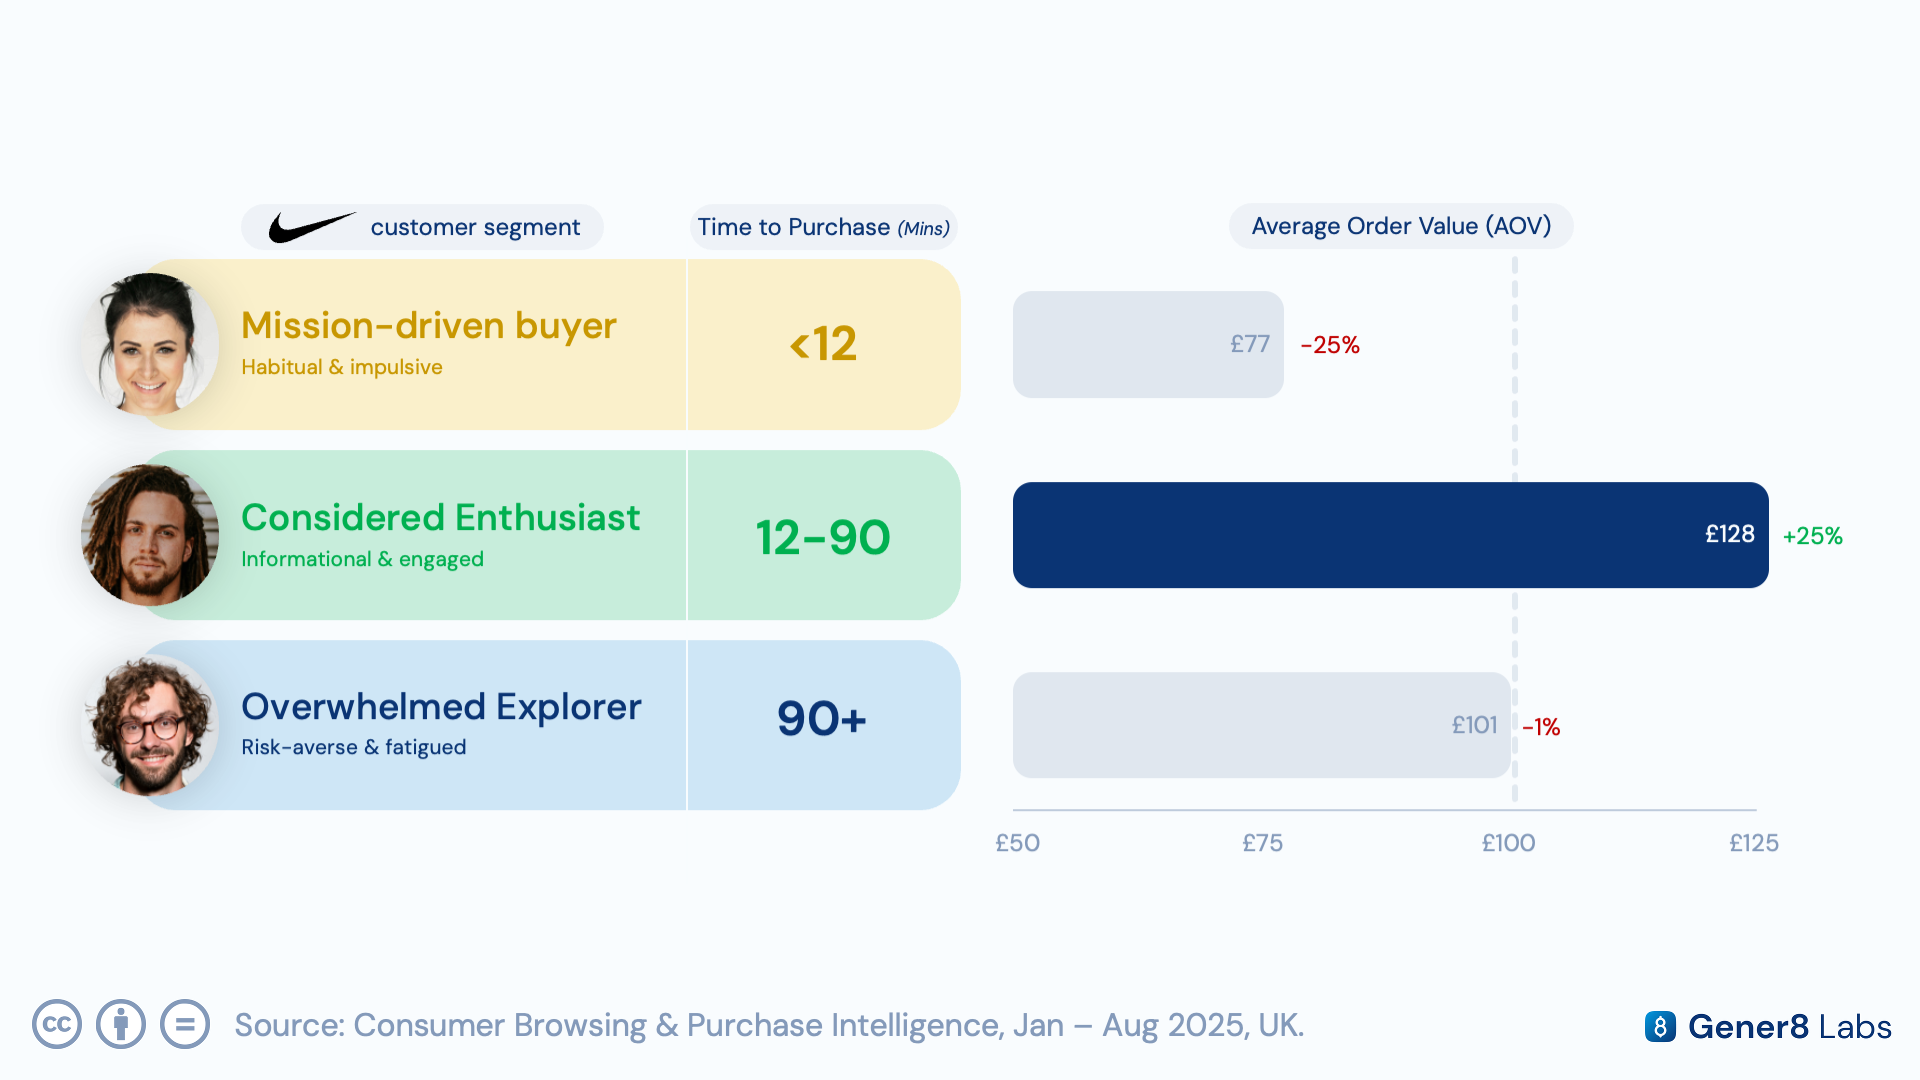
A similar pattern emerges when segmenting transactions by the time taken from the first site visit to the completion of a purchase, with Considered Enthusiasts driving the highest AOV at £128 (+25% vs. average).
These findings challenge the simplistic assumption that ‘more engagement is always better’. They pose a critical strategic question: Why do the most seemingly engaged users, those who invest the most time and view the most pages, fail to convert into the highest-value transactions? The answer lies in the varied psychological drivers, shopping missions, and cognitive experiences of different user types, each of whom requires a distinct strategic approach.
From a linear funnel to customer archetypes
The data from Nike.com's path to purchase reveals a critical limitation in applying a traditional, one-size-fits-all model to the customer journey. The analysis demonstrates that users do not follow a single, linear path to conversion; instead, they diverge into distinct behavioral patterns, each with its own unique psychology and financial outcome.
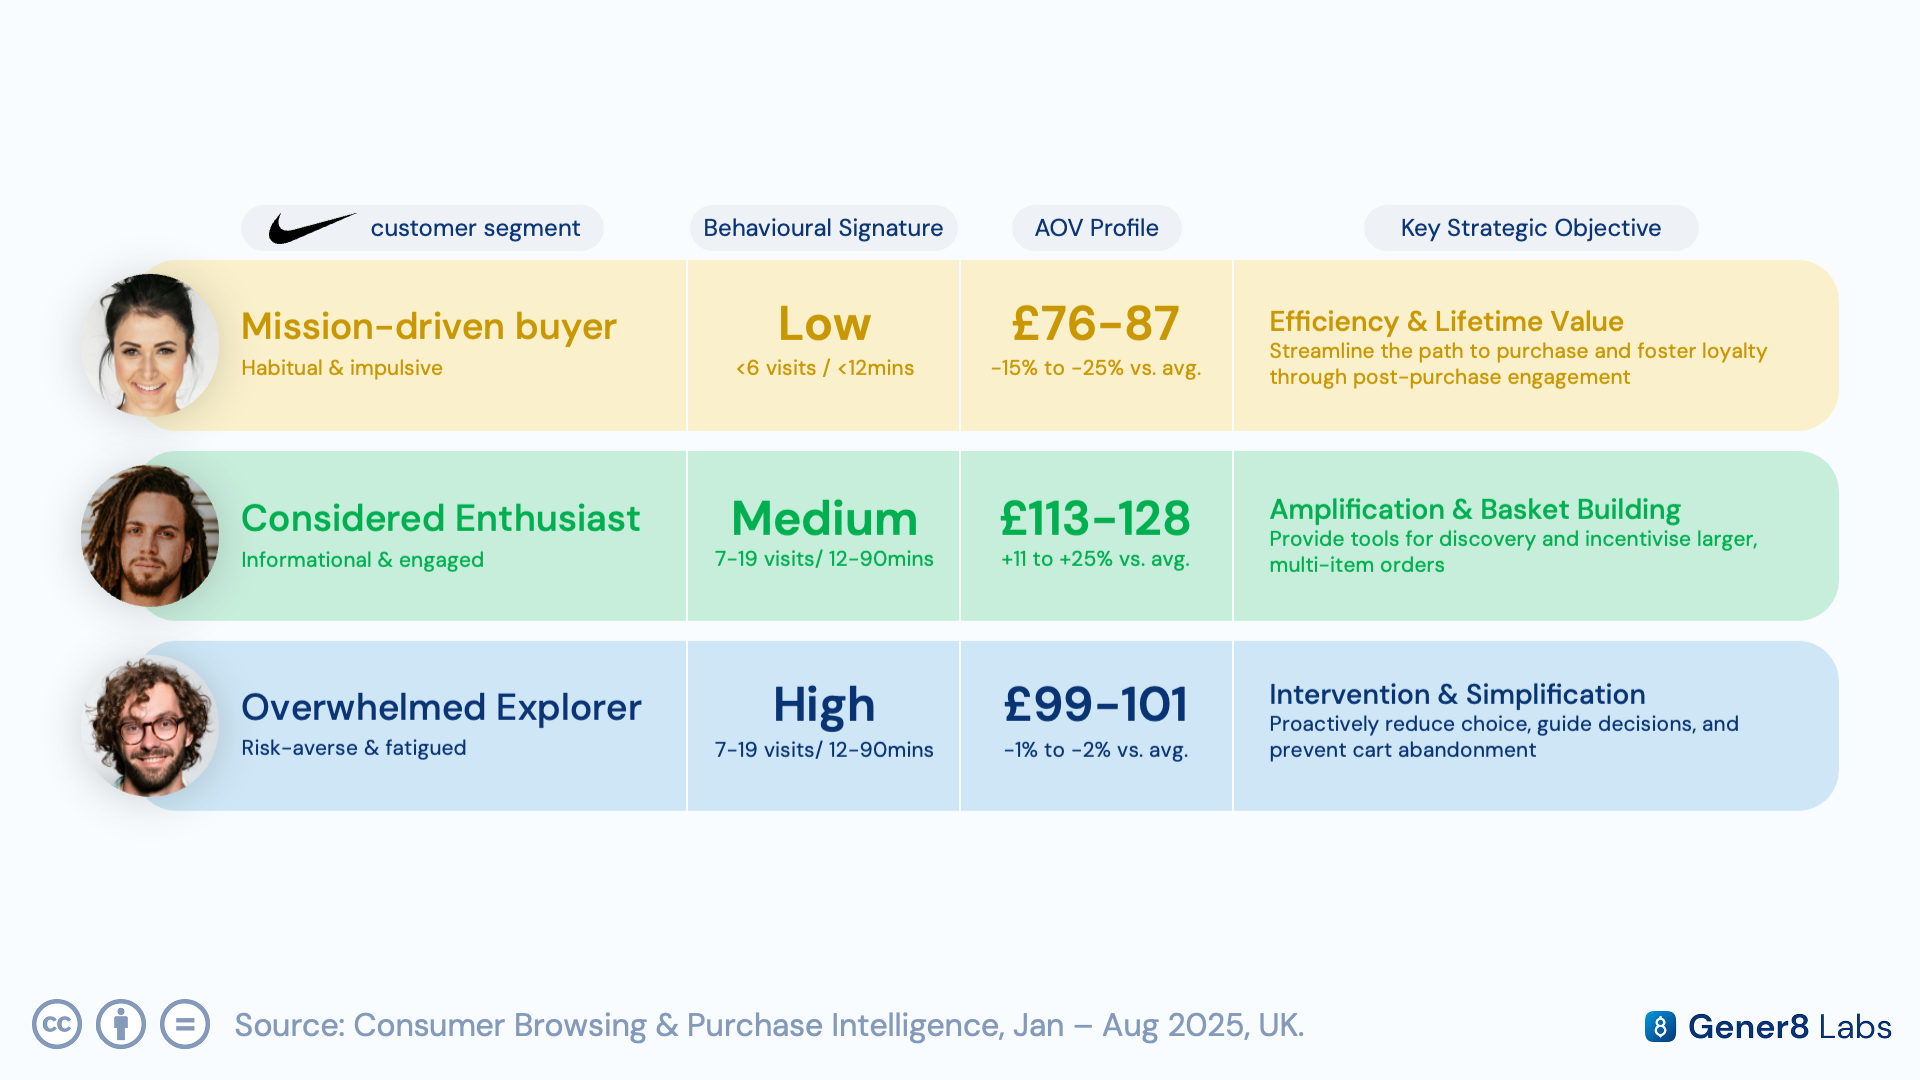
Mission-driven Buyer
Characterised by low engagement, fewer than six pageviews or less than twelve minutes on site, this segment should not be misconstrued as uninterested or disloyal. On the contrary, this group represents a highly efficient and focused type of consumer. Their behaviour is best understood not as a failed exploration, but as a successful, targeted mission. Their journey is short because they know what they want and how to get it.
Their lower AOV is a natural consequence of this focused behaviour, and the strategic goal should be to optimise for their efficiency while cultivating long-term value, rather than attempting to artificially inflate the value of a single transaction.
Recommendation: Streamline the path to purchase and foster loyalty through post-purchase engagement
Considered Enthusiast
The segment of customers defined by medium engagement, between 7 and 19 pageviews or a session duration of 12 to 90 minutes, represents the financial ‘sweet spot’ for Nike as their transactions generate the highest AOV.
It's a shopper who is actively seeking information and is receptive to product discovery, but who completes their journey before the onset of cognitive fatigue. Understanding the mechanics of this successful journey is key to amplifying its success and replicating its conditions for other user segments.
Recommendation: Provide tools for discovery and incentivise larger, multi-item orders.
Overwhelmed Explorer
The most counterintuitive finding from the Nike.com data is the decline in AOV for the most highly engaged users, those with over 19 pageviews or who spend more than 90 minutes on the site. This segment, which might traditionally be viewed as the most interested, paradoxically generates a lower AOV than their moderately engaged counterparts. This phenomenon is not an anomaly; it is a predictable outcome explained by well-established principles of behavioral economics and consumer psychology. They are spending less because they have become victims of cognitive overload, leading to decision fatigue and risk-averse purchasing behaviour.
Recommendation: Proactively reduce choice, guide decisions, and prevent cart abandonment.
This archetype-based model allows Nike to evolve from a reactive, one-size-fits-all website strategy to a proactive and dynamically personalised engagement strategy. By tracking the behavioral signatures of each user in real-time monitoring metrics like pageviews, time on site, and add-to-cart actions, the platform can identify which archetype a user is beginning to embody.
Once a user is flagged as a potential "Explorer," for example, after they have viewed their 15th product detail page without adding an item to their cart, the website can automatically trigger a set of tailored interventions designed to help them. This transforms the website from a static, passive catalog into a dynamic and responsive digital sales assistant. It is the online equivalent of a skilled retail associate noticing a customer looking lost in a vast superstore and proactively asking, "It looks like you're comparing a few different options. What are you looking for today? Perhaps I can help you narrow it down."
Leveraging Gener8’s interconnected panel for path to purchase analysis
At Gener8, we have a panel of 100k+ UK users that share multiple datasets linked together through one user ID, which allows us to pinpoint the exact second a customer made a transaction, either through:
- eReceipts from our Purchase Intelligence feed, or
- Visit to the purchase confirmation page from the Consumer Browsing feed
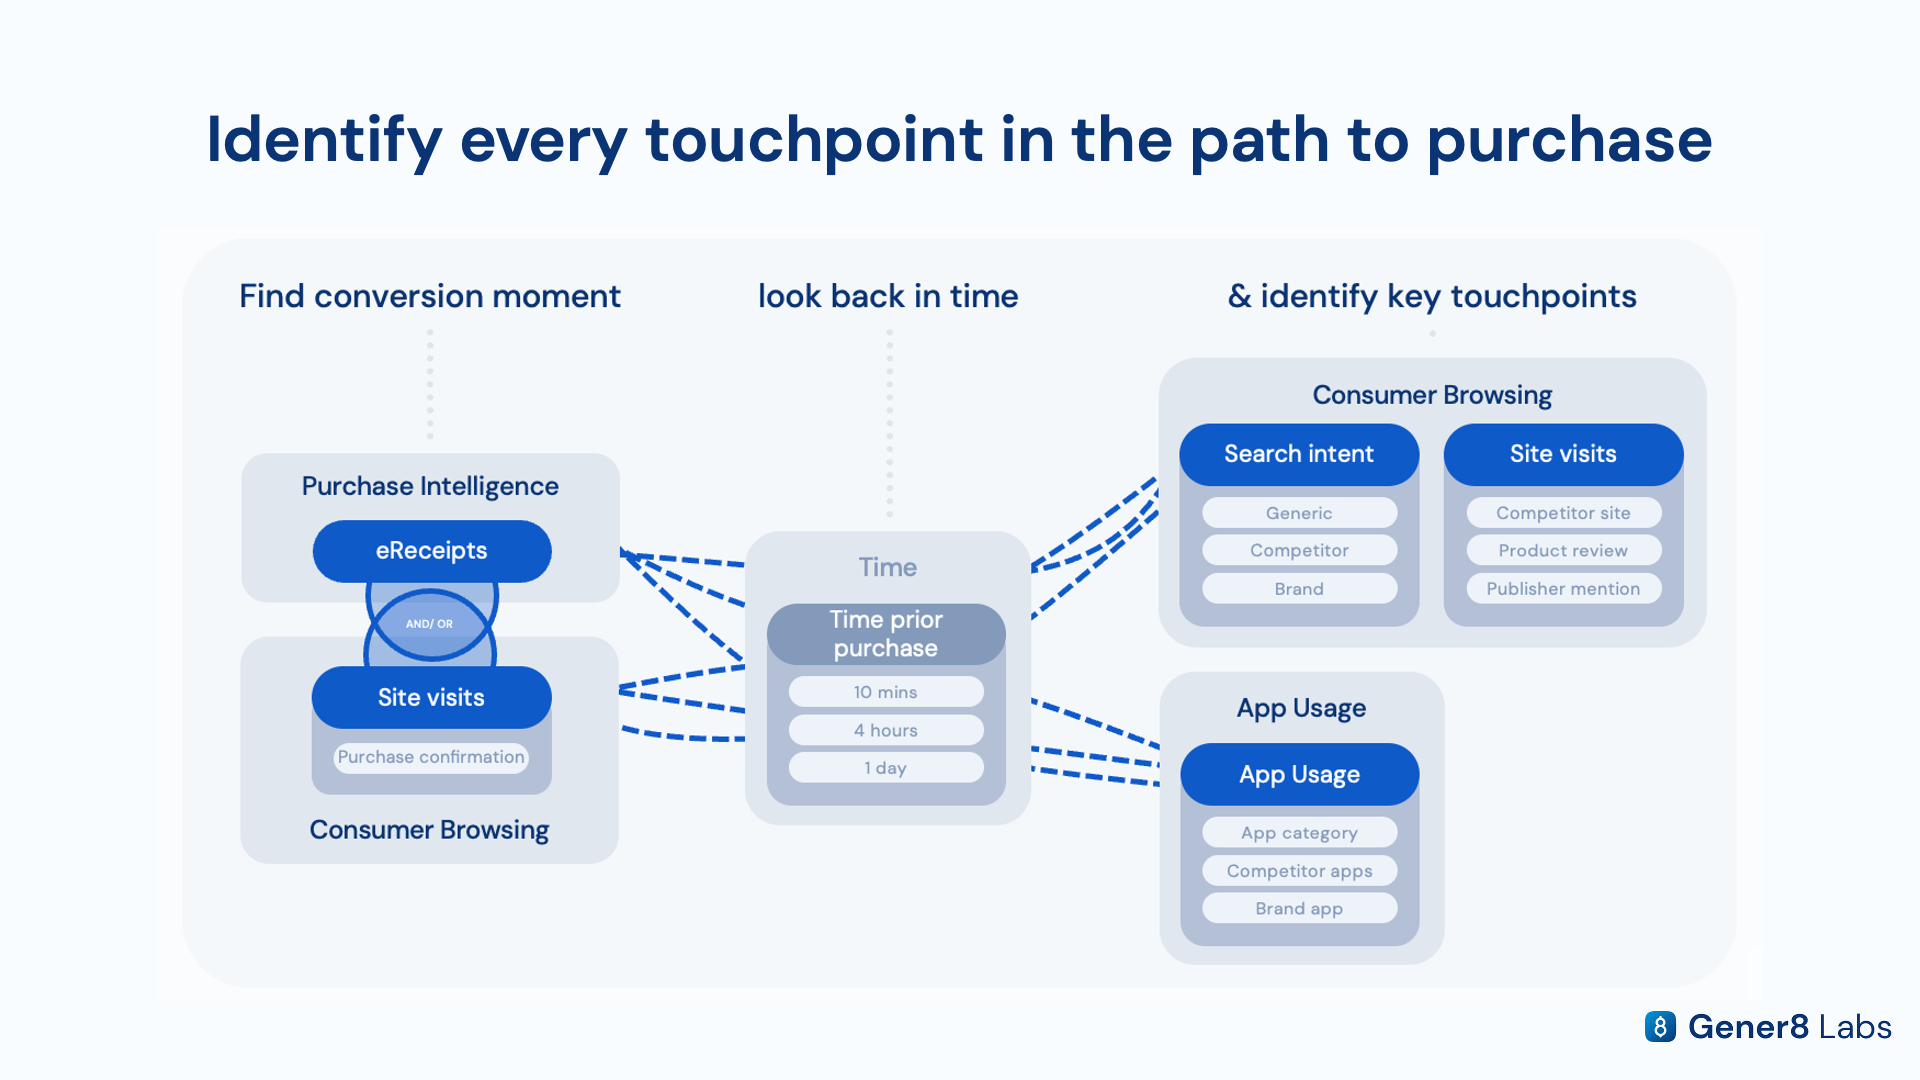
From there we can look backwards in time, whether that is in minutes, hours or days and identify key touchpoints in the purchase journey, such as:
- Generic searches on search engines
- Visits to a review site mentioning the brand/ product
- Views of relevant videos on YouTube
- Visits to publisher pages mentioning the brand/ product
- Opening of relevant apps
- Use of GenAI platforms such as ChatGPT and Gemini
This allows us to gain deeper insights into customer purchasing journeys than ever before, especially since Gener8 is the only platform in the world that connects clickstream behaviour with eReceipt transactions.
This enables us to:
- Get a macro view of digital customer journeys. Assess the average user purchase journey in terms of pages visited, visits to the basket, and the time taken to complete a transaction from the first visit
- Quantify the value of off-site touchpoints. Identify off-site behaviour gaps, such as generic searches and GenAI use, and understand their impact on conversion.
- Benchmark against the industry and competitors. Compare your site’s performance with close competitors and the industry vertical as a whole, highlighting strategic areas for improvement.
- Zoom into individual customer journeys. Dive deep into unfiltered user journey paths to identify common trends and potential UX enhancements.
How can I access this data?
We utilised Gener8's Consumer Browsing and Purchase Intelligence datasets to deep dive into Nike.com’s customer purchase journeys.
Gener8 Labs’ complete data and insights solution empowers media and marketing businesses to find actionable consumer and market insights, using our unique, consented, first party panel data sets that are all connected around one user ID.
Discover how you can power your decisions and gain a competitive edge from our behavioural truth set by contacting us today!